
SALEM, Ore. — Full-service graphic design firm QA Graphics was recently hired to install its Energy Efficiency Education Dashboard at Chemawa Indian School, the oldest continuously operating boarding school in the United States.
The school is using the dashboard to monitor electricity, water and gas use throughout the campus to determine areas in which students and staff can make better use of resources.
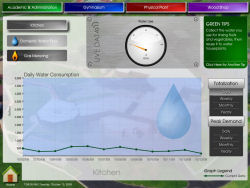
Displayed on a 19-inch monitor located in the boiler room, as well as online through a graphical user interface, the dashboard shows water flow, electricity and gas use in real-time with daily, weekly, monthly, and yearly statistics, allowing students and staff to closely monitor consumption.
Through a direct link, the dashboard is able to communicate with the school’s building automation system to determine resource usage in the dormitories, gymnasium, woodshop and kitchen. Additionally, it provides information and tips on how to conserve water and electricity.
 After updating the school’s control system with Alerton’s Envision for BACtalk to address a number of deficiencies with Chemawa’s previous control system, officials decided to use the dashboard to track the improvements. In addition to using it to promote campuswide efficiency, Chemawa Indian School plans to use the dashboard to monitor the efficiency of a new LEED-certified dormitory that was completed in early 2010.
 Since installing the dashboard, school officials have noticed a high spike in energy use in the mornings, which they determined was caused by outdated electric water heaters in the old dormitory.
The new dormitory’s boilers and domestic water heaters both have an 87 percent efficiency rating, and the building’s air handler and chiller units are designed to be highly efficient. Other energy-saving features includes motion sensors for lights and some fixtures with dimmers.
QA Graphics has installed its dashboard in schools, libraries, universities, government buildings and restaurants, providing a variety of interfaces and system components. The company can include a variety of features, including historical comparison graphs, calculators to compute savings, animated demos explaining how green features work, environmental tips, leaderboard comparisons among multiple buildings and other custom options.
Oftentimes the Web-based dashboard is much like a Web site, with online access to its applications. In many cases, organizations display the dashboard in the lobby of buildings in which the program is tracking energy use.
“Each energy dashboard that we build we develop specifically for what the customer wants,” says Sarah Erdman, marketing director at QA Graphics. “We work with them to provide content and explanations and to format the layout, demos and graphics.”
Popular features include the head-to-head comparison tool, allowing contests between buildings or even floors to determine who is the most energy efficient — a popular approach for green initiatives in dormitories.
Schools can also easily incorporate the data into curricula. Using interactive quizzes, energy-saving tips and animated demonstrations, the dashboard can supply students with a variety of information. QA Graphics can also install school-relevant features into the dashboard, including school menus, academic calendars, faculty lists and overall building displays with energy information.
Additionally, QA Graphics can build weather monitors as well as animated demos and 3-D models designed to teach how certain energy-saving devices work.